
20 min read
Displaying Data
Bar charts and pie charts turn a frequency table into a picture that is quick to read.
Pictures of Data
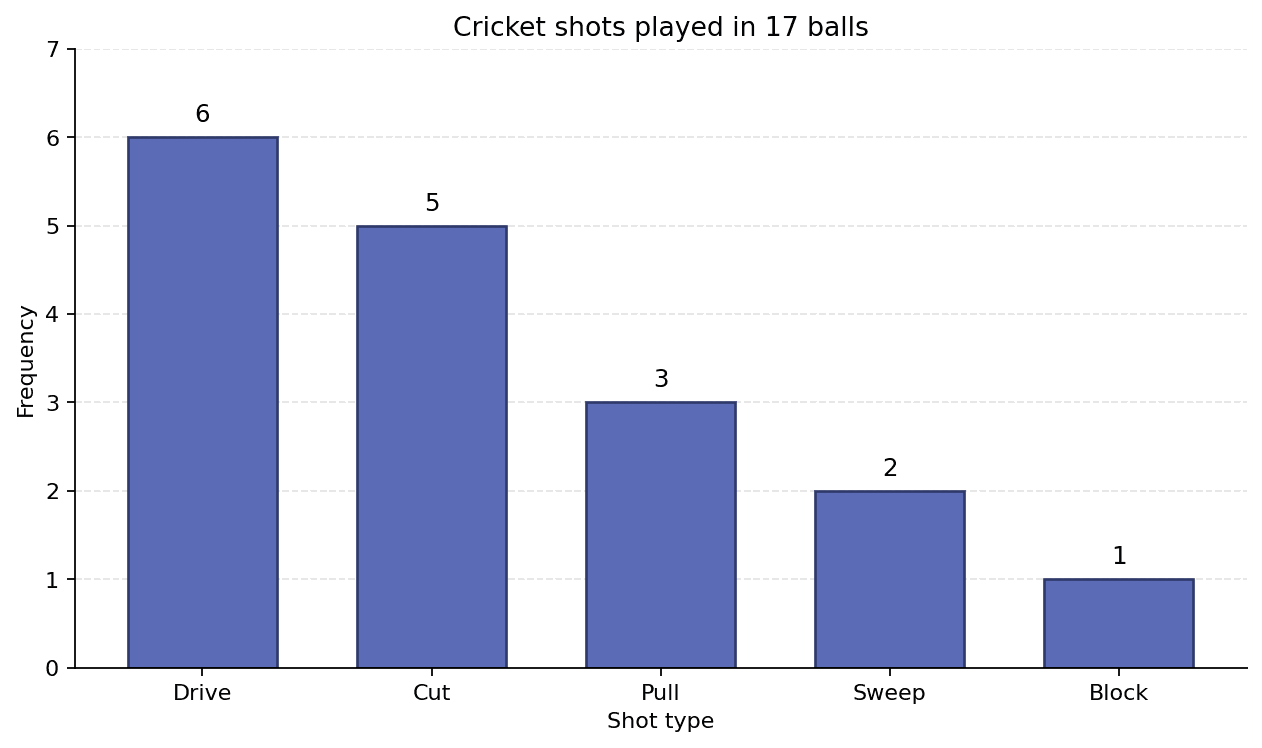
A bar chart uses the height of each bar to show a frequency, making categories easy to compare at a glance.
Favourite sport in a class survey
Football
12
Basketball
8
Swimming
5
Tennis
3
Cricket shots played in 17 balls
Drive
6
Cut
5
Pull
3
Sweep
2
Block
1
Pie Charts
A pie chart shows each category as a slice of a full circle (°). The angle of each slice is proportional to its frequency:
angle = (category frequency ÷ total frequency) × °
Example 1 — finding a pie chart angle
people were surveyed, and of them chose category A. Find the angle of category A's slice in a pie chart.
- Find the fraction of the total:
- Multiply by °: °
Answer: °
Practice
Your answer
More lessons in Descriptive Statistics · Next: Comparing Data Sets · Previous: Range and Quartiles