
55 min read
Descriptive Statistics — Assignment Prep
Mean, median, mode, range, frequency tables, and bar charts — Concept, Worked Example, and Practice for each skill.
E1 — What Is a Statistic?
A statistic is a single number that summarises a set of data. Four of the most useful ones answer four different questions:
- Mean — what is a "typical" value? Add all the values, then divide by how many there are.
- Median — what is the middle value once the list is sorted?
- Mode — which value appears most often?
- Range — how spread out is the data? Highest value minus lowest value.
Key idea: mean / median / mode describe the centre; range describes the spread.
E2 — Mean, Median, Mode, and Range from a List
When you have a raw list of numbers, follow this order every time:
- Sort the data (needed for the median; also makes the mode easier to spot).
- Mean = sum ÷ count.
- Median = the middle value. With an odd count, take the centre position. With an even count, average the two middle values.
- Mode = the value with the highest frequency (a list can have no mode, one mode, or several modes if there is a tie).
- Range = largest − smallest.
Key idea: sort first — then mean, median, mode, and range are all straightforward.
Example 1 — Worked example — nine test scores
Scores (out of ):
Step — sort.
Step — mean. Sum , count :
Step — median. Nine values → middle position is the 5th.
(If there had been an even count, you would average the two middle values.)
Step — mode. appears twice; every other value appears once.
Step — range.
Answers: mean , median , mode , range .
Practice . For the data , find the mean ( d..), median, mode, and range.
Answers: sorted . Mean . Median . Mode . Range .
Practice . For the data , find the mean, median, mode, and range.
Answers: sorted . Mean . Median (even count). Mode = 76$= 92 - 76 = 16$.
Practice — cricket runs. Runs scored off balls: . Find the mean ( d..), median, mode, and range.
Answers: sorted . Mean . Median . Mode . Range .
E3 — Organising Data into a Frequency Table
A frequency table lists each unique value (or category) once and shows how many times it occurs.
That works for numbers ( pets, pet, …) and for labels (Drive, Cut, Pull, …). The tally method is the same.
Key idea: after you fill the table, add the frequencies — they must equal the original total count. That check catches most tally mistakes.
Example 1 — Worked example — pets owned (20 students)
Raw data:
Step . List every unique value: .
Step . Tally how many times each appears.
Step . Check the total: ✓
| Pets owned — frequency table | |
|---|---|
Example 1 — Worked example — cricket shots (categories)
A batter faces balls. The shot types are:
Drive, Cut, Drive, Pull, Cut, Sweep, Drive, Cut, Pull, Drive, Block, Cut, Drive, Sweep, Cut, Drive, Pull
Step . List every category: Drive, Cut, Pull, Sweep, Block.
Step . Tally:
| Shot | Frequency |
|---|---|
| Drive | |
| Cut | |
| Pull | |
| Sweep | |
| Block | |
| Total |
Check: ✓
The mode (most common shot) is Drive. For labelled categories like this you usually stop at the frequency table and the mode — mean and median of the labels do not make sense.
Practice . Build a frequency table for:
Answer:
| Value | Frequency |
|---|---|
| Total |
Check: ✓
Practice — more cricket shots. Build a frequency table for these shots:
Cut, Drive, Cut, Pull, Cut, Drive, Sweep, Cut, Drive, Cut, Pull, Cut, Drive, Hook, Cut, Drive, Cut, Sweep, Cut, Drive
Answer:
| Shot | Frequency |
|---|---|
| Cut | |
| Drive | |
| Pull | |
| Sweep | |
| Hook | |
| Total |
Check: ✓. Mode = Cut.
E4 — Mean, Median, and Mode from a Frequency Table
You cannot "eyeball" the middle of a frequency table. Use these rules:
- Weighted mean
- Median — make a cumulative frequency column, then walk down until you pass the middle position(s).
- Mode — the value with the highest frequency.
Key idea: for even , the two middle positions both matter; for odd , one middle position is enough.
Example 1 — Worked example — using the pets table
Using the pets frequency table (total ).
Mean (weighted):
Cumulative frequency:
| Pets | Frequency | Cumulative frequency |
|---|---|---|
Middle positions for are and . Both fall in the " pet" row (cumulative reaches there).
Mode (frequency is the largest).
Answers: mean , median , mode .
Practice . Books borrowed in a week:
| Books | Frequency |
|---|---|
Find mean, median, and mode. ()
Answers: Mean . Cumulative: → positions and are in the " books" row → median . Mode (frequency ).
Practice . Minutes of phone use (grouped as whole minutes for this table):
| Minutes | Frequency |
|---|---|
Find mean, median, and mode. ()
Answers: Mean . Cumulative: → positions and are in the "" row → median . Mode (frequency ).
E5 — Visualising Frequency Data with a Bar Chart
A bar chart shows each category as a separate bar. For discrete counts ( pets, pet, pets, …) the bars should not touch — these are separate categories, not a continuous scale.
Use a bar chart here, not a line graph, because the horizontal values are discrete categories.
Key idea: discrete categories → bar chart with gaps between bars.
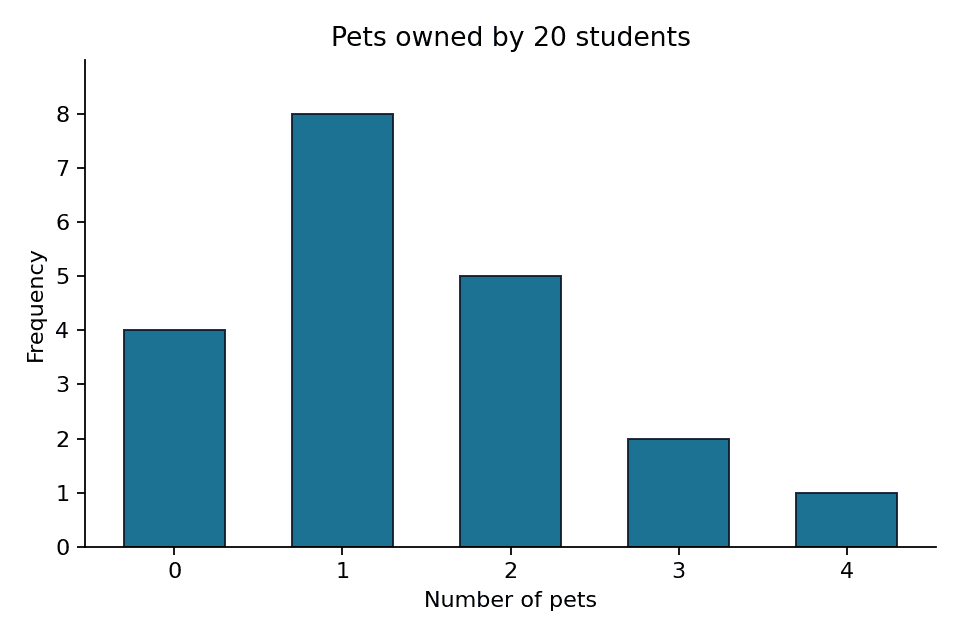
Example 1 — Worked example — reading the pets chart
From the bar chart (and the table behind it):
- The tallest bar is pet (frequency ) — that matches the mode.
- Bars for , , , , stand separately with gaps — correct for discrete data.
- Heights add to — same total as the class size.
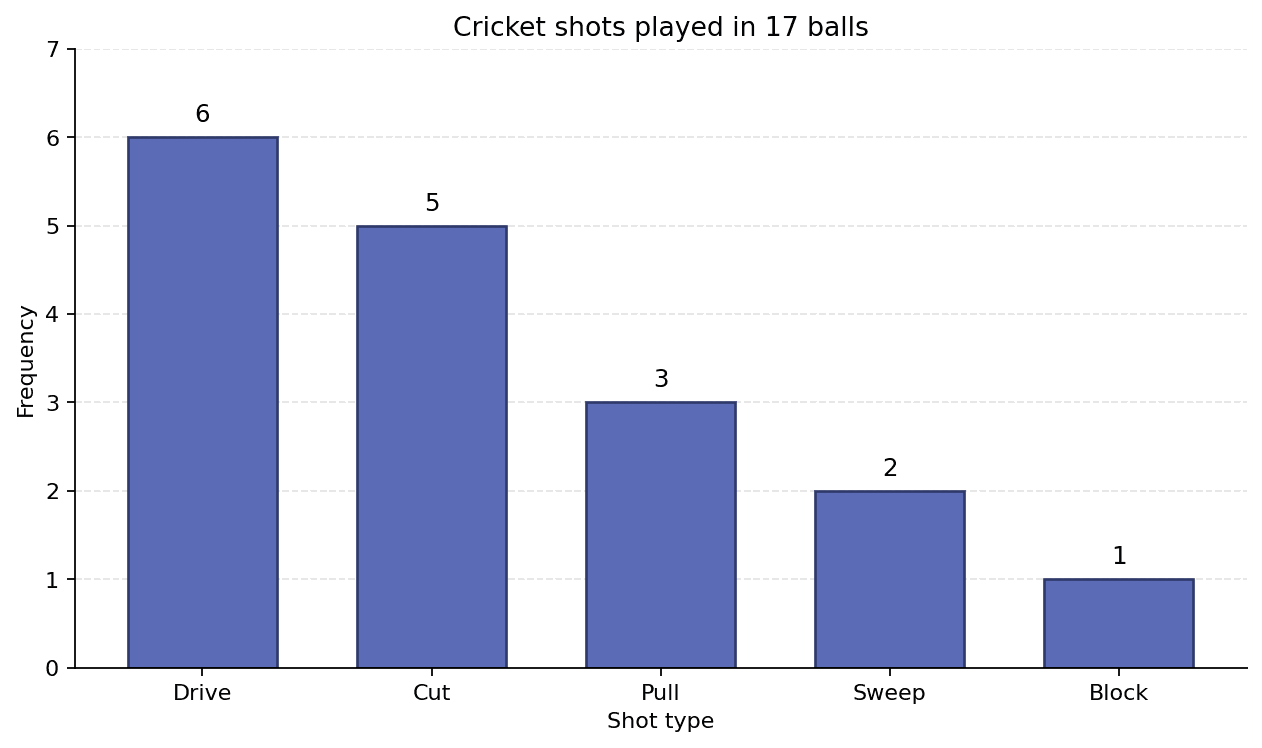
Example 1 — Worked example — reading the cricket shots chart
From the cricket shots bar chart ( balls):
- Tallest bar = Drive () → mode.
- Cut is next () — almost as common as the drive.
- Heights: ✓
- Categories are words, not numbers — still a bar chart with gaps, not a line graph.
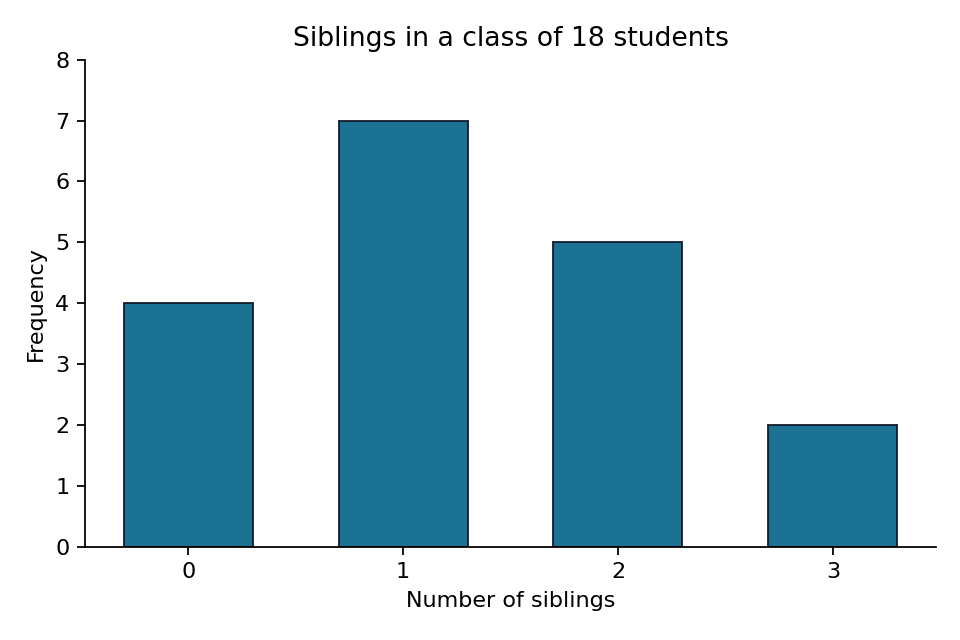
Practice . Sketch (or complete) a bar chart for this frequency table of siblings in a class of :
| Siblings | Frequency |
|---|---|
Label the axes "Number of siblings" and "Frequency", leave gaps between bars, and give the chart a title.
Practice . Using the cricket shots chart above, answer:
- Which shot is the mode?
- How many more cuts than pulls were there?
- What fraction of the balls were drives?
Answers: . Drive. . . . .
More lessons in Descriptive Statistics · Next: Types of Data · Previous: Introduction