
22 min read
Recap E — Descriptive Statistics
Mean, median, mode and range from lists and frequency tables, and bar charts — 15 worked examples.
The Big Idea
Descriptive statistics summarise a set of data with a few numbers:
| Measure | What it tells you | How to find it |
|---|---|---|
| Mean | the "fair share" average | add all the values, then divide by how many there are |
| Median | the middle value | sort the values, then find the middle |
| Mode | the most common value | the value that appears most often |
| Range | how spread out the data is | largest − smallest |
1. From a List
Example 1 — the mean
Question: Find the mean of , , , , .
Answer:
Total . There are values. Mean = 25
Example 2 — the median (odd number of values)
Question: Find the median of , , , , .
Answer:
Sorted: , , , , . Five values → position . Median
Example 3 — the median (even number of values)
Question: Find the median of , , , , , .
Answer:
Sorted: , , , , , . Six values → position , so take the mean of the 3rd and 4th values:
Example 4 — the mode — one, two or none
Question: Find the mode of (a) , , , , , (b) , , , , , (c) , , , .
Answer:
- (a) — it appears three times
- (b) and — both appear twice (two modes)
- (c) no mode — every value appears once
Example 5 — the range
Question: Find the range of , , , , .
Answer:
Largest − smallest
Example 6 — all four (like the paper)
Question: students' scores: , , , , , , , , , , . Find the mean, median, mode and range.
Answer:
Sorted: , , , , , , , , , ,
- Mean
- Median = 6th value =
- Mode = (three times)
- Range
Example 7 — a missing value
Question: The mean of numbers is . Four of them are , , and . Find the fifth.
Answer:
Total of all . Total of the four . Fifth
2. From a Frequency Table
Example 1 — make a frequency table
Question: students said how many pets they own: , , , , , , , , , , , , , , , , , , , . Make a frequency table.
Answer:
Count how many times each value appears (a tally helps), then add the column:
| Pets () | Tally count (f) | f × |
|---|---|---|
| Total |
Check: the frequencies add up to ✓
Example 2 — the mean from a table
Question: Using the pets table, find the mean.
Answer:
Mean pets
Example 3 — the median from a table
Question: Using the pets table, find the median.
Answer:
values → the median is the mean of the 10th and 11th values. Count down: pets covers positions ; pet covers positions . The 10th and 11th are both , so the median is .
Example 4 — the mode and range from a table
Question: Using the pets table, find the mode and the range.
Answer:
- Mode: the highest frequency is , for pet
- Range
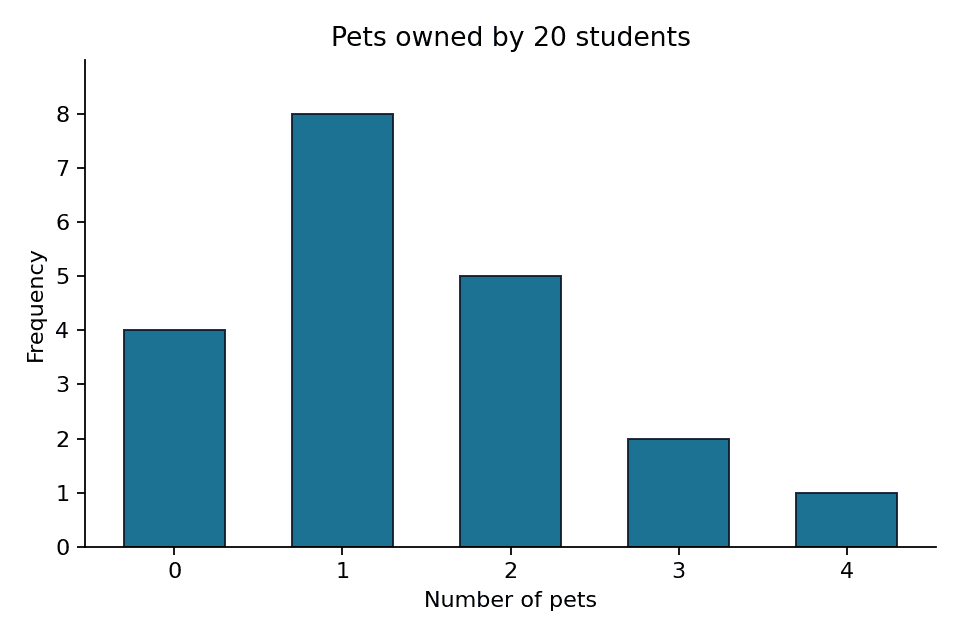
Example 5 — draw a bar chart
Question: Draw a bar chart of the pets data.
Answer:
Values () on the horizontal axis, frequency on the vertical axis, a title, labelled axes, and equal gaps between the bars (the data is separate whole numbers).
3. Choosing and Comparing
Example 1 — an outlier
Question: Incomes (LKR): , , , , . Which average best describes them?
Answer:
Mean — higher than four of the five incomes. Median = . The median is better, because the outlier ( ) pulls the mean up.
Example 2 — adding the same number
Question: Every value in a data set is increased by . What happens to the mean and the range?
Answer:
The mean increases by . The range stays the same, because the largest and smallest both move up by .
Your turn — try these on paper, then check the answers below.
. Find the mean, median, mode and range of , , , , .
. Find the median of , , , .
. A table shows , , with frequencies , , . Find the mean.
Example 1 — Answers to Your Turn
. Sorted , , , , . Mean ; median ; mode ; range
. Sorted , , , →
. ; ; mean
Next: Recap F — Probability
More lessons in Recap and Practice · Next: Recap F — Probability · Previous: Recap D — Trigonometry